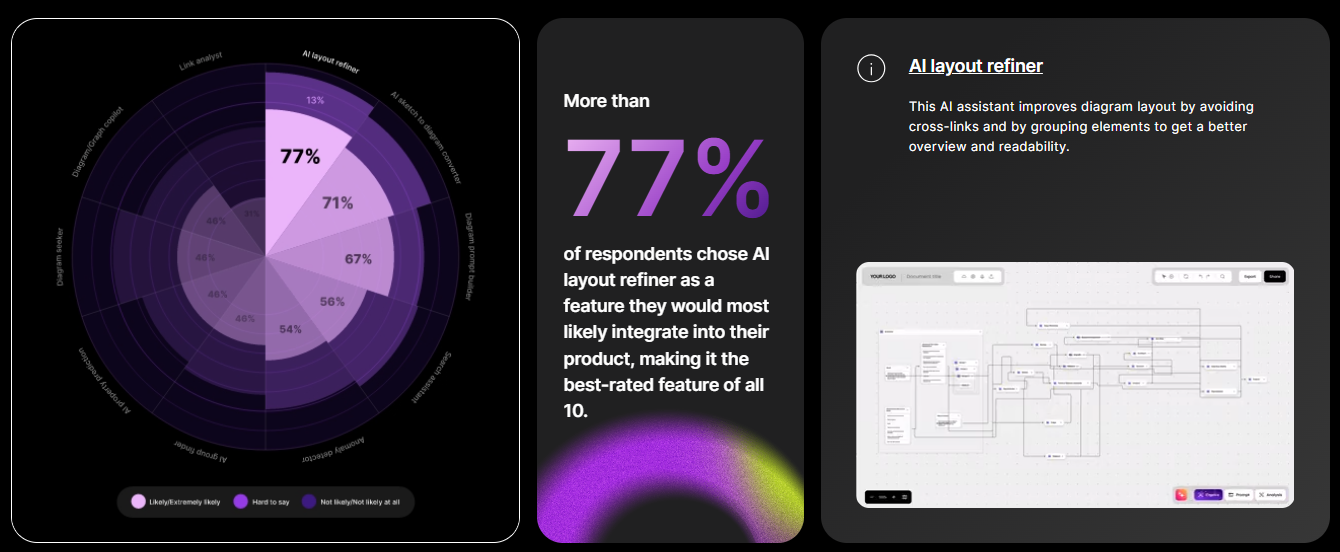
Based on interviews and a survey of diagrammatic experts - we have prepared a report.
Direct link here.
If you have any suggestions or questions - please write boldly
PMarcin
Posts
-
Report: AI in data visualization -
Introduce yourselfHi everyone!
I'm a Product Manager and enthusiast of (not only this) community. I have been working with data visualizations for over a year. I'm not technical, but I know that without the perspective of experienced developers, you can't build good produtcs.
-
GoJS Course threadJoin the GoJS Course to learn how to develop interactive diagrams using the GoJS library.
By the end of the course, you’ll have a fully functional family tree application, gaining hands-on experience with key GoJS features.Course is public on GitHub
Feel free to feedback and ask questions in this thread
Remember that we have seperate thread for homework PR.
-
GoJS Chrome ExtensionGoJS development with advanced Chrome DevTools extension for diagram inspection, debugging and exploration. Download directly from the Google Web Store
This is a beta version. If you have any questions/concerns, or suggestions related to the development - go ahead and write.
-
VislabsJavaScript diagram library built on four foundations: Design System, UI library, Diagram library, AI for diagrams. For more information, visit https://www.vislabs.ai/
Feel free to share your opinions and thoughts
-
Workflow BuilderWorkflow Builder built on components for easy customization.
Demo Version 1.0. available at https://www.workflowbuilder.io/Version 1.1. in development
Feel free to ask question and share feedback
-
dAIgram AppFree tool for digitizing and editing diagrams. Including hand-drawn ones.
Beta version available at: https://www.daigram.app/If you have any questions or comments. Write boldly!
-
Graph EditorWe launched a free database visualization as Knowledge Graph with edit functionality.
Feel free to use and share your feedback: https://www.grapheditor.io/